MDM Reference • Correlation & coherence
Correlation and Coherence
Correlation records how strongly two series move together, across the whole record. Coherence records the same tendency rate by rate. The two are companions, one a broad summary and the other a fine account.
Correlation as a standardised covariance
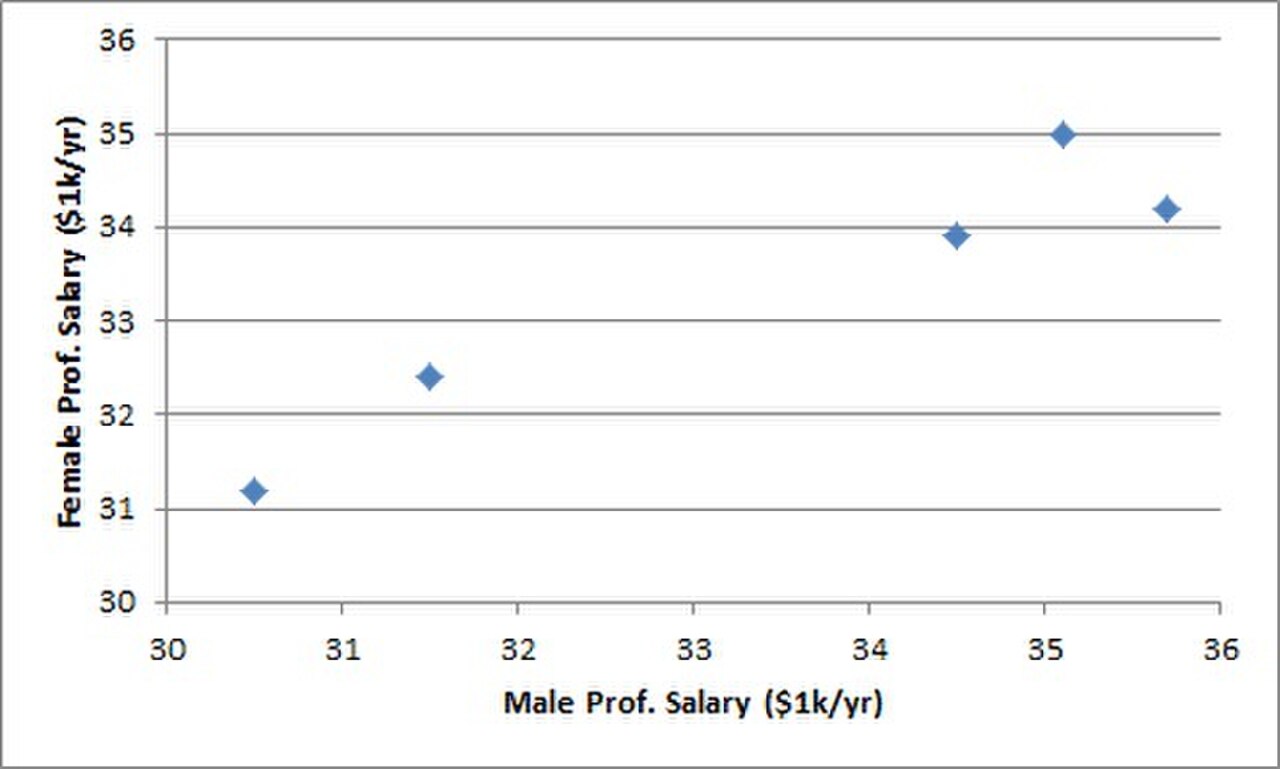
The correlation between two series is their covariance divided by the product of their standard deviations. Confined between minus one and one, it is independent of units and therefore comparable across pairs. Its value describes only linear movement: a strong curved relation may yield a small correlation, and a small correlation does not certify independence.
Serial correlation
Within a single series, readings at separated instants may still move together. The autocorrelation is the correlation of the series with itself at a stated lag, and its profile as a function of the lag is a compact portrait of how quickly the series forgets its own recent values. A profile that decays slowly marks a strongly persistent series; a profile that crosses zero quickly marks one that forgets swiftly.
Cross-correlation and lead
Two series may be compared at a range of relative shifts, and the shift at which their movement is strongest may be read as a lead or lag of one behind the other. This reading is a useful first guide, but a strong cross-correlation at a shift is not proof of a causal link; it is an account of joint timing within the record examined.
Coherence
Coherence extends correlation to each rate. At a given rate it measures how steadily the two series keep a fixed phase relation. A coherence near one marks a faithful linear relation at that rate; a coherence near zero marks an absence of such a relation, whether through independence or through a varying phase. Coherence is the spectral face of correlation, just as the spectrum is the spectral face of the series.
Reading the pair together
Correlation and coherence answer different questions and may disagree. Two series may be strongly correlated overall while their coherence is weak at most rates, which signals that the relation lives at a few rates only. The reverse may also occur. A careful account quotes both, so that the reader is not misled by a single summary of a rich relation.
Cautions
Both measures assume that the relation is stable across the record. If the joint behaviour changes midway, the summary hides the change, and the analysis should be repeated on the separate parts. This is the same caution that holds for any single summary of a varying series, and it is repeated here because it is so easily forgotten.
A worked reading
Suppose two series move together over a long record, giving a strong overall correlation, yet at most rates their phase relation wanders. The overall figure is then carried by a narrow band where the two do keep step, while the rest of the record contributes little to it. A reader given only the overall figure would overstate the breadth of the relation, and this is the reason the desk urges both measures to be quoted.
Lags and their limits
A cross-correlation may be computed at each of many relative shifts, and it is tempting to read the largest value as a lead of one series behind the other. The reading is an account of timing within the record, and it does not by itself establish that one series drives the other. A careful account states the shift and leaves the question of cause open.